

VILLAMARV
-
Posts
9,226 -
Joined
-
Last visited
-
Days Won
16
Content Type
Gallery
Downloads
Profiles
Forums
Blogs
Articles
Media Demo
Store
Events
Posts posted by VILLAMARV
-
-
Just now, omariqy said:
Man Utd next 3 games are Chelsea (a), Liverpool (h) and Bournemouth (a)
If they make up 6 points on us in that run then I might be worried. They've also got Arsenal and Brighton left.
And Newcastle to rearrange from FA Cup Semifinal weekend.
Chelsea and Liverpool are this week 3 days apart too. (Thur/Sun)
-
10 hours ago, romavillan said:
He's definitely our best defender and he's up there for our best player.
The shortlist internally for player of the season this year is insane really. Bailey, Luiz, Watkins and Konsa in particular are having real stand out seasons.
Konsa's answered everything we asked about him when Mings got injured and then some. He's having a great season.
-
 1
1
-
-
5 minutes ago, 5-1 said:
Diane has to start at the moment
Saucy suggestion
-
 2
2
-
-
3 minutes ago, VillaChris said:
they could be playing that on the same night as we play a potential SF!
this would be interesting as they'd either end up with Arsenal - Chelsea - Liverpool in 8 days or Liverpool - Chelsea - Burnley - Man City - Sheff Utd 5 games in 15 days at the end
But basically their easier on paper run in could get a bit more congested and the 2 games to squeeze in somewhere are far from easy.
-
2
-
-
I wonder when their (Spurs) postponed games (away v Chelsea and at home to Man City) get rearranged for. If Man City get past Real Madrid they might not be available until the last week of the season midweek - unless they squeeze it in a few days after the FA cup semis. I'd have thought they'd want to get the trip to Chelsea out of the way sooner rather than later so surely at the same time as weplay against Lille at home would be ideal. I can't see Chelsea wanting it 3 days before the FACup semi against City. If not then, it too is probably pushed back till May.
-
I think Spurs will sneak ahead of us over the next few weeks but that we'll pull it back by the end of the season.
It'll be interesting to see how the top 4 handle their(our) European games. I'm glad we haven't got an extra game to fit in like some teams do, because of the FAcup draws.
-
FTLOPM podcast reckoned that along with Stevenage, Wolves are the only English team Unai has ever played that he's never beaten. Be a great day to put that stat to bed.
-
As for the return of the thread titles, it seems Ezri might be on board
QuoteEzri Konsa insists Aston Villa have nine finals remaining this Premier League season as the club targets qualifcation for Champions League football.
https://www.birminghammail.co.uk/sport/football/football-news/nine-finals-ezri-konsa-nails-28912436

-
2
-
-
17 minutes ago, mjmooney said:
Folk/rock drummer Gerry Conway (Fairport Convention, Jethro Tull, Cat Stevens, etc.), 76.
apparently most recently of Pentangle too, as he was married to Jacqui McShee.
-
Did everyone else play the card game Shithead at school? I'm wondering what regional variations are out there? In name and rules.
Ace is high, 2's and 10's go on anything - 10's trashes the pack. 4 of a kind become the equivalent of a 10 and 9's are lower than a nine or another 9 or a 10) but can't be played on an ace.
-
1
-
-
If my early education taught me anything it was that porn comes from cemeteries
-
1
-
-
30 minutes ago, chrisp65 said:
It’s only the seedless sub human cucks that don’t enjoy a positive parenting story.
No offence meant there, to the degenerates incapable of forming a fruitful biblical union.
Hang on, I enjoyed it, but I'm obviously in the wrong cohort...
-
17 hours ago, Panto_Villan said:
Hmmm, I don't think you're interpreting the data correctly there. You're right that gains in life expectancy are averages, so a reduction in child mortality increases it without increasing the expected lifespan of an adult, but seeing large movements because of that tends to happen in countries that are still developing rather than advanced economies with good healthcare. Infant mortality is still decreasing here, but it's already low so there's a limit to how much further it can decrease.
As for the bolded part - check the data. That's true today, but it was also true in 2010 and in 1980 and for every other year in the spreadsheet. It would only not be true if you're in a country where life expectancy is rising EXTREMELY quickly.
The reason why is that any 66 year old alive today by definition is not one of the people who died young and dragged the average down for everyone else. The average life expectancy for a baby born today would probably be closer to 85 or 90 if you stripped out everyone who is going to die before they reach the age of 65 (which is what you're doing when you check the life expectancy of someone who is still alive at 66). It's the inverse effect of child mortality pulling life expectancy down for everyone else; if you survive childhood that means you'll probably outlive the average life expectancy.
I've used the word 'therefore' at the end of the bolded bit instead of something better, like 'just one of the many indices that have combined to show an overall trend towards diminshing life expectancy that explain'...why epidemiologists..... etc. But, yeah fair cop, the way I've written it misrepresents the point I was trying to make so fair enough. I'd also, having read back what I wrote, perhaps change the words "recorded history" to "since the second world war". It's a more easily argued position.
But other than some poor choice of wording I'll stand by the rest of the post. The point still stands that life expectancy is declining, for the first time in at least 79 years and unusually during 'peacetime' and outside of any pandemic. The point still stands that epidemiologists have pointed at this trend and suggested we take it seriously.
The point also still stands that you appeared to be using at birth data to make inferences into retirement age when you replied to tinker citing the ONS at birth data. The corrections to your figures stand with or without the editorial changes above. I suppose that's built on the assumption that you were back engineering the data on the graph you posted. If I remove that potentally unfair assumption, I suppose I could just more simply ask, where did you get the 5 and 12 year figures from you were using?
As for the child mortality bit, in my post, I thought I was clearly suggesting a reason as to why we should be careful ascribing causality to raw data. And a reminder that - especially when makng statements without citation - we run the risk of incorperating bias or prejudice. I wonder if your assumptions around how much the UK could further reduce child mortality might fall foul of this type of hubris. Our child mortality rates may compare favourably to those in developing nations but we don't exactly compare all that favouribly with our more developed peers any more. While we may still be on a downward overall trend in child mortality figures the rate of the decline has slowed comparatively with other EU15+ nations.
Quote........a group of comparable wealthy countries identified as appropriate comparators for UK mortality. These countries are the 15 member states of the European Union in 2004 (excluding the UK) together with Australia, Norway and Canada, referred to as the EU15+..........
..........UK mortality over the past 40 years plotted against EU15+ mortality centiles for the same period. These figures show that in 1970, UK mortality was below the 25th centile in all age groups aside from infancy which was higher (50th centile), and 5–9-year-olds which was lower and fell below the 10th centile. By 2010, the UK's position had declined markedly in all age groups. UK infant mortality was above the 90th centile in 2012, and on the 75th centile for young children 1–4 years. For 5–9-year-olds and 10–19-year-old boys, UK mortality in 2010 was very close to the 50th centile. For 10–19-year-old girls, mortality in the UK was close to the 75th centile. We have previously shown that these differences are statistically significant; mortality in the UK declined significantly less than the EU15+ over the past 40 years.
BMJ - "UK child survival in a European context"
I'd be more inclined to ask Swden et al if there are things we could learn from their comparative success in takling child mortality, than hide behind the notion that we have little progress left to make - as seems to be a point made in your post. I appreciate there are external variables that can skew the figures - that's exactly the point I was making. Seemingly, a point we were both making. And not the only one - I agree the difference is huge between a retiree's life expectancy in 1980 as compared to now - around 5 years - that's a huge difference. We seem to agree that there's been a significant increase in inequality since the 1970's.
The argument of "people are living longer" is ultimately a subjective one. They are if mapped over a period of time which would show an overall increase and within a collective group large enough to dilute the findings to the contrary. Like we agree, that 5 year difference between a 1980 retiree's life expectancy and a retiree now is massive. If we change the time period or the geographical areas (to more localised ones as tinker was suggesting with the West Mids data) or indeed - and this was the crux of the conversation I interjected into - into areas of affluence or areas of poverty we get very different results and ultimately a different answer, that people are not living longer as a standalone statement of fact. People using this data to back up an argument about pensions and people arguing about observed and recorded societal trends. They are not neccessarily mutually exlusive. As you alluded to, people can often pick facts to suit a narrative, rather than go where the research takes them - when you suggest picking a narrative to suit the facts, I'm not sure that sounds like a healthy counterbalance. The facts can speak for themselves imo. We're back to avoiding inference.
What I would assert the research of UK life expectancy shows is that there is an undeniable, observable correlation between higher life expectancies in more affluent areas and lower life expectancies in poorer areas. A correlation that very much replicates outside of the UK. And some places managed to record 17 year gains of around 9 years in life expectancy, nearly double the already agreed upon 'huge' 5 years we were discussing from your example (as tinker also alluded to - as found in some parts of London)
Quotebetween 2002 and 2019, life expectancy increases of nine years or more were seen for men and women in some parts of central and north London.
https://www.imperial.ac.uk/news/231119/life-expectancy-declining-many-english-communities/
And yet from the same research -
QuoteThese trends created stark geographical differences. In 2019, there was about a 20-year gap in life expectancy for women living in communities with the highest and lowest life expectancies (one region of Camden had a life expectancy of 95.4 years, compared to a community in Leeds with a life expectancy of 74.7 years).
For men, the gap was 27 years (life expectancy in one area within Kensington and Chelsea was 95.3 years, compared to 68.3 years in a part of Blackpool).
These variations are massive. As others have said the numbers of people with debilitating illnesses is increasing, the problems associated with inequality, if we just carry on as we are, will only get worse.
-
I also realise I haven't tested my theory since the great sugar purge
-
Inspired by the Midori tale in another thread, Midori and Britvic blackcurrant cordial tastes like jelly babies. In my experience this is brand specific on the cordial.
-
1
-
-
13 hours ago, Panto_Villan said:
You're right that life expectancies have declined over the past five years, but even if you take that into account then they've still increased significantly overall in recent decades. Men today live 2.2 years longer than they did in 2001.
see above
-
18 hours ago, Panto_Villan said:
Life expectancy hit a peak in 2019 and has been declining since then, but it's clearly still increased significantly since the 1980s. Men would have expected to live 5 years after retirement in 1980, and now they'd expect to live about 12 years if they retire at 66. That's clearly a huge difference.
The graph you are presumably looking at when writing this is based on life expectancy at birth. Therefore a baby born in 1980 would on average be expected to have a lower life expectancy than a baby born in 2019 or now in 2024. However that finding at birth is not replicated in the older generations. An important thing to understand from these ONS figures is that a 66 year old today can expect, on average, to reach an older age than a baby born today. If we look at the ONS life tables (which is the source data for the above graph) they state that a 66 year old male in 1980 could expect, on average, to live an extra 12.35 years (So roughly until 78) whereas now (in 2022 - the last available data) a 66 year old male could expect an extra 17.48 years. (i.e to live until they are 83/84). Which is higher than babies born today (males @78.57 - females @82.57) and therefore why epidemiologists have raised the alarm regarding "declining life expectancy".
Life expectancy is falling. For the first time in our recorded history babies being born today are not expected to reach the same age as their parents/grandparents. It's really important that we don't attribute life expectancy at birth to life expectancy of somebody retiring today.
It's obviously really complicated, but important to note that some of the 'gains' in life expectancy are to do with less 0 year old babies dying. It's too simplistic to attribute these gains only to retired people living to an older age. What we are seeing in these historic times is that I'm not expected to live as long as my parents and my (hypothetical) children are not expected to live as long as me.
-
 1
1
-
-
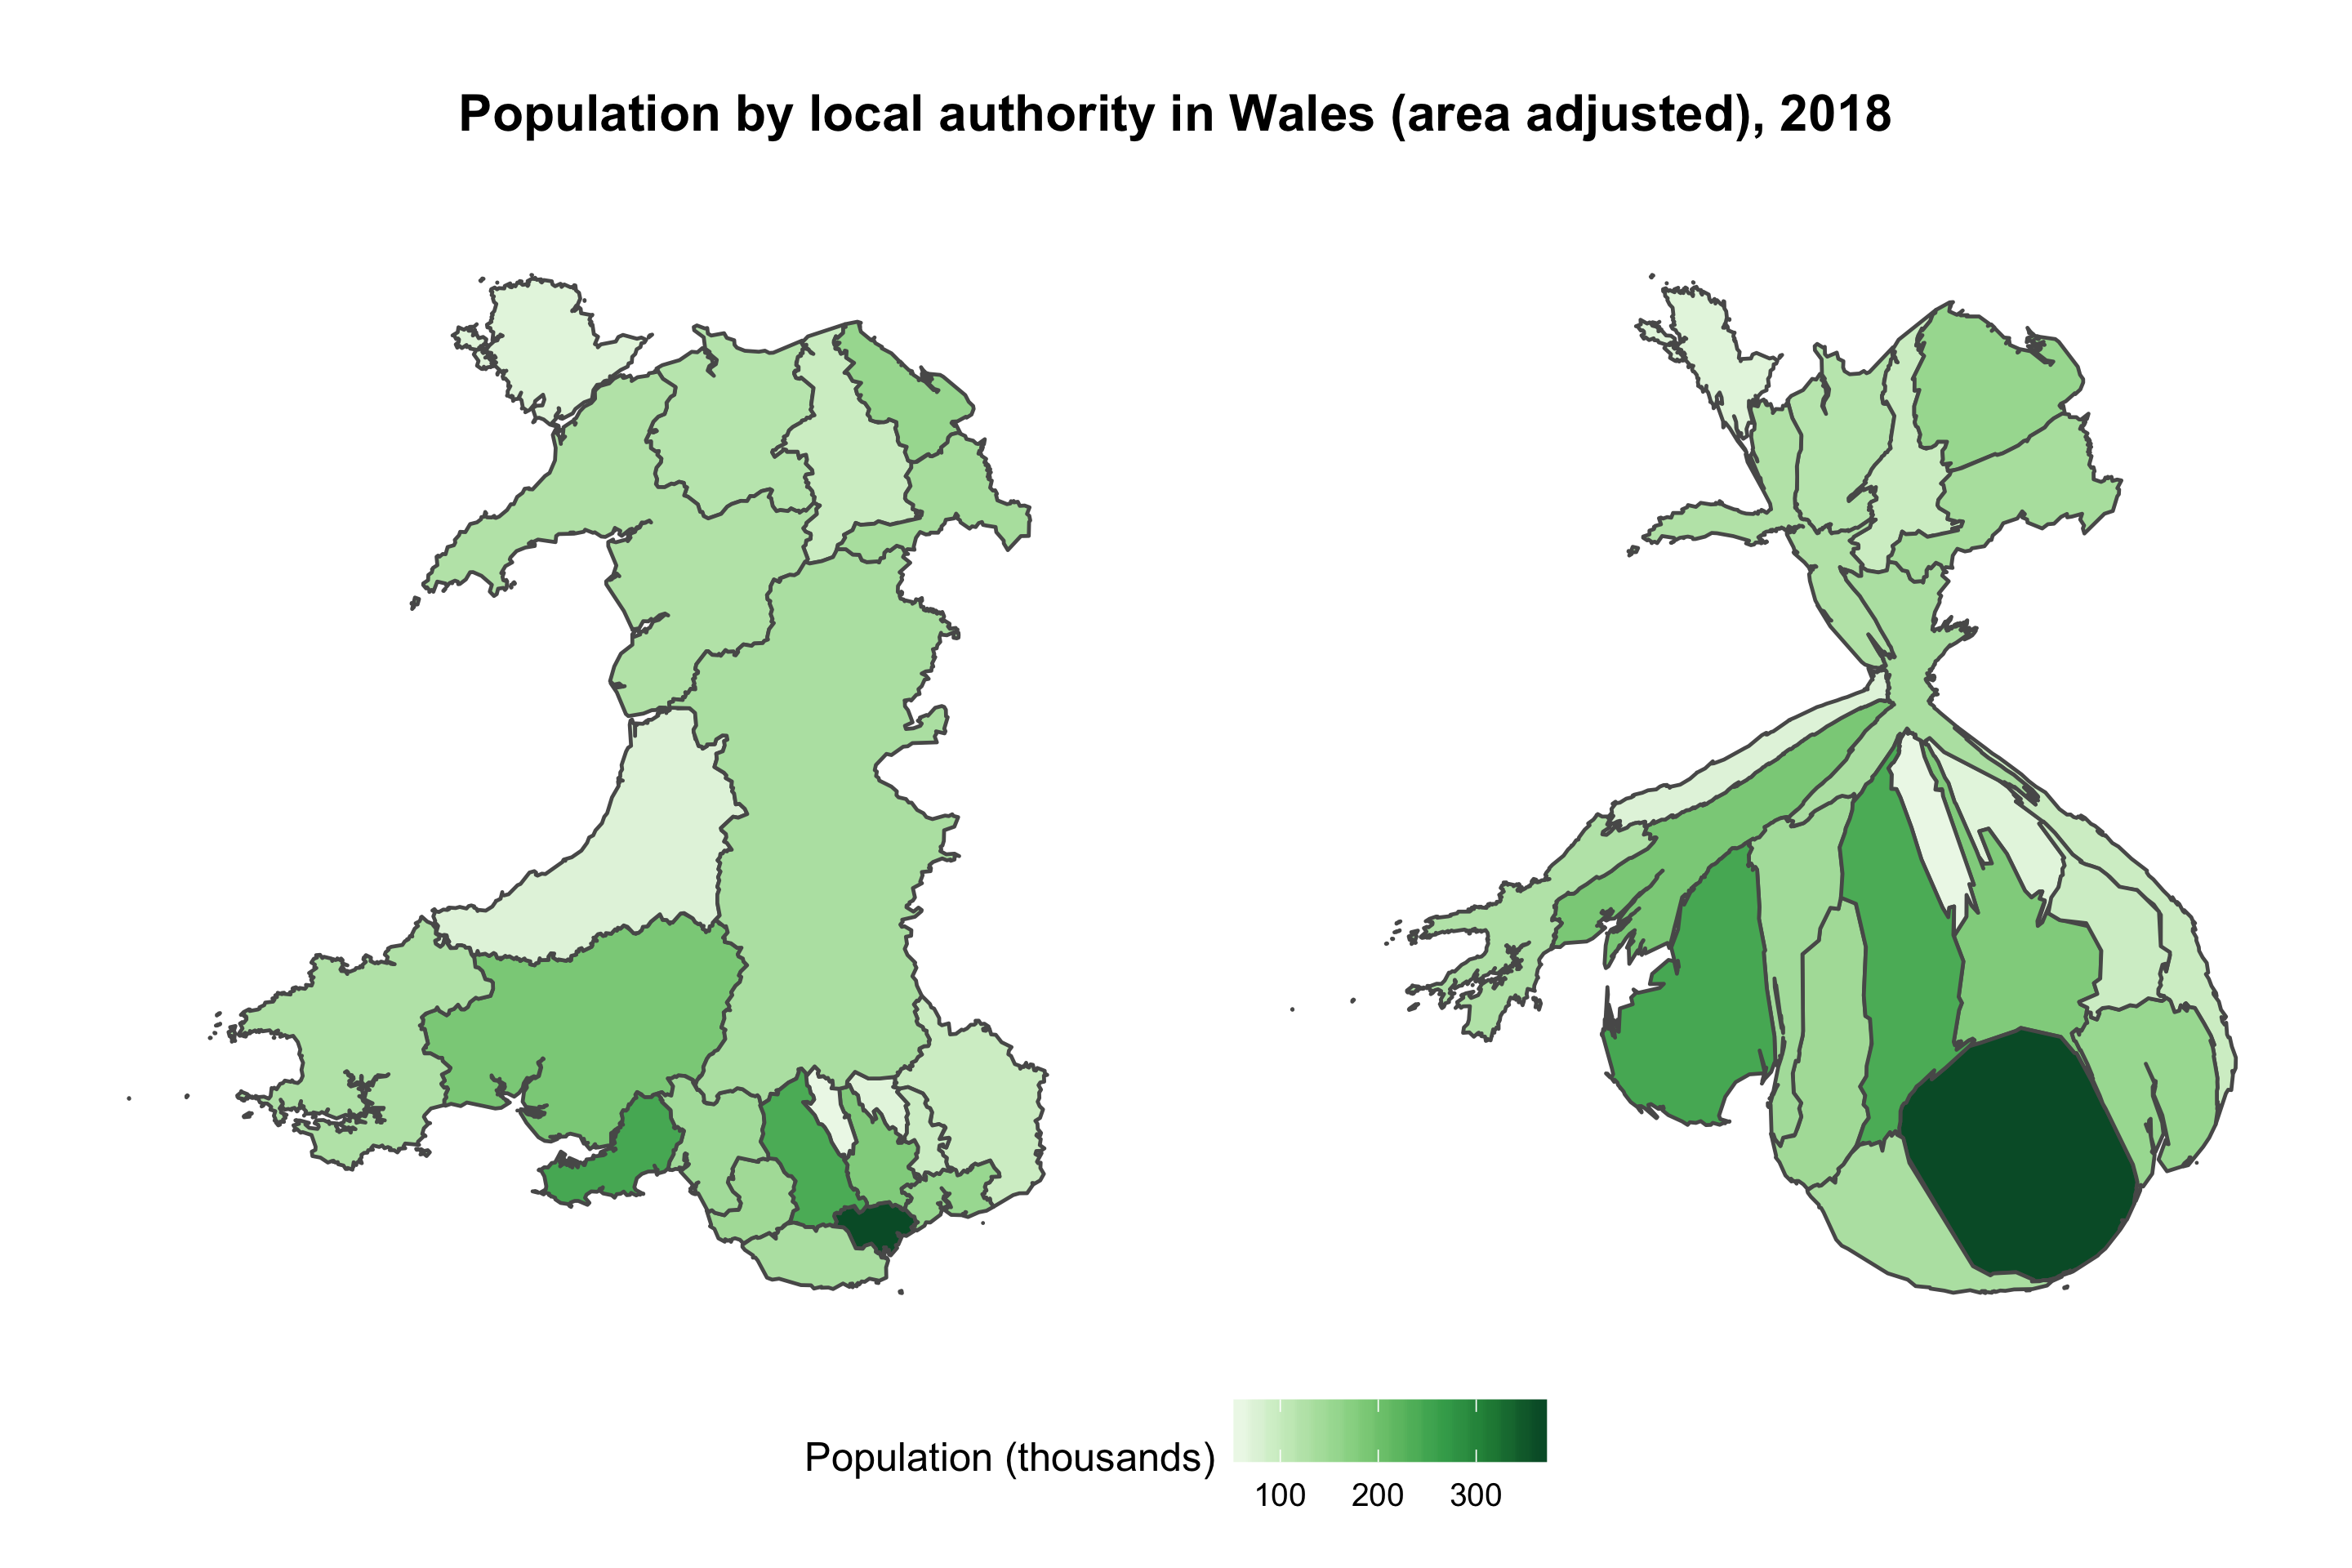
Having mentioned in another thread the other day about NUTS 2 areas in Wales and how West Wales was the 'poorest area in Northern Europe' - but the map itself didn't necessarily reflect the population distibution, this map caught my eye.
http://tom-e-white.com/datavision/03-wales-population-cartogram.html
QuoteMost people in Wales live in Cardiff and the South Wales Valleys, which were industrialised in the 18th century. The west and middle of the country is very sparsely populated.
This visualization shows the relative size of local authority populations in Wales by distorting the map so that each authority has an area that reflects the size of its population.

-
1
-
-
19 hours ago, Xann said:
Disinformation isn’t always about favoring a particular side. It helps hostile authoritarian states like Russia—or domestic authoritarians like Trump—undermine the foundations of governance, causing people to lose faith in democracy itself. “The objective is to get a society to the point where nobody knows whether something is real or not, and therefore, that society cannot function,” says Taylor. Sometimes chaos is the only goal.
I'll occasionaly make reference to Surkovs Non-Linear Warfare - basically lifted from Adam Curtis's Hypernormalisation - people are happy to accept the concept framed as Russian malevolence. But as a tactic it's absolutely by design and the idea that it's confined to Russia or China or N.Korea is laughable.
-
On 18/03/2024 at 14:47, dAVe80 said:
Standing up for what you belive it right can be hard, and it takes resolve that some that sneer could only dream of
This bit has stayed in my mind since you wrote it. I couldn't agree more.
I'm watching an Indian documentary called To Kill a Tiger and it reminded me of this quote.
-
1
-
-
- Popular Post
- Popular Post
I think we could really think outside the box and set a new trend in having 2 stadiums. If it's good enough for badges....
-
1
-
6
-
I for one am glad he's obviously so shit. I presume, as he's not good enough for England that none of the real, more important teams, you know, the ones that are just all round better clubs with real fans that really matter wont want him.
etc
-
1
-
1
-
-
I appear to have 6 garlics I obviously missed harvesting last year. I assume they'll be alright, never had surprise garlic before.
In the flat I have infestations everywhere. The Olive and Kaffir Lime have got scales, I reckon there's still spider mites on my fern and loads of greenfly on a thyme plant, which I realised because there' a ladybird been hanging around for a few wintery months and it's presently tucking right in, perhaps having the thyme of its life.
This indoor gardening thing was much easier when it was all succulents and cacti. On the plus side we have grown a little orange.
-
2 week trial IIRC


Race for Champions League - 2023/2024
in Villa Talk
Posted
While we're chatting Utd's remaining games the rearranged game at home to Sheff Utd is midweek between Cov in the semi and Burnley at home, Other than that they have Bournemouth and Palace, same as we do, With a game to rearrange against Newcastle and Arsenal and Brighton.
I'm not worried about Utd personally.